Data collected for this report are from multiple places. Trempealeau County has a database available for download located at http://www.tremplocounty.com/landrecords/ . This database included much of the information needed, like an elevation DEM, road networks, parcel data, school locations. A land use-land cover map was downloaded from the National Land Cover Data-set website. Our water table elevation map was brought in from the Wisconsin Geological Survey website. The cell size for each pixel in all the maps are 30x30 meters. The reason for this is that this is the lowest spatial resoultion for the maps, and in order to be accurate with all the analysis, I had to run the output cell size as 30 meter.
Land Suitability
The ranking systems used in our raster analysis is that the most suitable lands are given a value of 3, lands that are in the medium are given a 2, and lands that are the least suitable are given a 1. For elevation, it is only broken down into a 2 for the most suitable, and a 1 for the least suitable. After overlaying the 5 total rasters, the pieces of the lands will have a score between 5 and 14, with 14 being the most suitable pieces of land and the 5 being the least suitable pieces of land. Rivers and urban areas are removed and not eligible for the final raster calculation.
Figure 1, is the the master key for the following maps that were created. Using the master key, it will tell you all the values that were used in creation of this map. Justifications for why these values were used are in the following paragraphs. To see the image in greater detail, click on the image itself to see the full sized version.
For the first portion of our data analysis, multiple rasters were created based on an estimation of suitability. The first raster I created was an estimation of suitable elevation for sand mining. According to an unknown research project that was stated in the directions, suitable sand frac sand mining are located within the Jordan and Wonewoc formations. Using my estimations, I determined this formation to be between 250-400 feet in elevation. I used the reclassify tool on the Trempealeau County DEM, and gave values of 250-400 feet a 2 while values less the 250 and greater than 400 a 1.


Figure 1 is the master key for both Land Suitability and Risk Assessment Maps

Figure 2 is the raster reclassification of the elevation of Trempealeau County.


Figure 1 is the master key for both Land Suitability and Risk Assessment Maps

Figure 2 is the raster reclassification of the elevation of Trempealeau County.
The second raster analysis used was to determine suitable mine based on land use- land cover. I sorted through the categories of land use- land cover and gave each category a value 1 through 3 as shown in figure 1. I reclassified the raster based on these values. For the land use land cover, I gave lands that were farmland, barron, or shrub scrub a value of 3, lightly vegetated areas a value of 2, densely vegetated areas like a forest a value of 1, and areas that were wetlands or water a "no data" so they were excluded from the map. I based these land classifications on ease of access to clear the land to produce a sand mine.
 Figure 3 is the raster reclassification of the land use-land cover in Trempealeau County

The third objective was to create a raster on proximity to railroads. I used Euclidean distance to the nearest railroads terminals. As shown in figure 3, all the sand mines located in Trempealeau County go to one of two railroad terminals. I reclassified each of these Euclidean distances by using equal intervals and gave each zone a value between 1 through 3. I based these values on a equal interval of three classes. Refer back to the master key to know the value ranges.

Figure 4 is the raster reclassification of the distance to the nearest railroad terminals.
The fourth objective was to the original DEM of Trempealeau County and to run the slope tool to determine the slope located throughout the county. After running the slope tool, I reclassified the newly created raster into more suitable lands based on the slope, I again assigned values between 1 through 3 for the suitable lands. I gave these values a natural breaks interval for the slope grade.

Figure 5 is a raster reclassification of the slope ratings in Trempealeau County
The fifth objected was to take the water elevation contour lines and create a raster for suitability Sand mines use lots of water, so water that is situated closer to the surface was rated higher than water that is not. First I had to take the contour lines and create a raster by using the topo to raster tool. After creating the raster, I then reclassified the raster with by assigning values between 1 through 3. I based these values on the height of the water table. I used an natural breaks interval for this sand mine because of the random heights of the water table.


Figure 6 is the water table height for Trempealeau County
After the creation of these rasters, I then used the raster calculator tool to find the most suitable land for sand mining in the Trempealeau County. Values range from 5, which is the lowest suitableness possible, to 14 which the highest, most suitable location possible. As seen below, you can see the different values represented by different colors in the map.
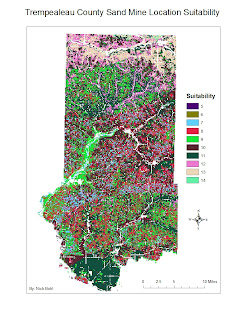 Figure 7 is the final raster overlay, which showcases the most suitable and least suitable locations in Trempealeau County

Figure 8 is the workflow model for the sustainability portion
Risk Assessment
The second part of this report is a risk assessment of lands in Trempealeau County. This is where we are going to take important environmental, and public factors into account. Risk assessment factors that we are looking at are lands near residential neighborhoods, lands near public schools parcels of land, lands located near streams, lands located near wildlife areas, and lands situated on prime farmland.
The ranking scale for Risk Assessment is that the lower the total score, the least suitable that piece of land is. The higher the score, the more suitable that piece of land is. Please refer back to the master key for details on the value meanings
The first risk assessment factor I am looking at is Residential Zoned areas. Here I took all the residential zoned areas located within the Trempealeau County database and ran a Euclidean Distance tool. The reason for running the Euclidean Distance tool is because sand mines can not be located within 640 meters of residential areas. After running the tool, I then reclassified the the Euclidean distance to 1 class, and gave it a rating of 3 for highest risk assessment possible.


Another assessment is a map of all the prime farmland located within the county. Prime farmland is a rarity and once a sand mine is put on it, the farm land would lose its value. Here I reclassified the prime farmland and gave it a value of a 1 for highest risk assessment, and a value of 3 for the lowest risk assessment
 Figure 13 is a Risk Assessment map of locations located on prime farmland in Trempealeau County


Figure 8 is the workflow model for the sustainability portion
Risk Assessment
The second part of this report is a risk assessment of lands in Trempealeau County. This is where we are going to take important environmental, and public factors into account. Risk assessment factors that we are looking at are lands near residential neighborhoods, lands near public schools parcels of land, lands located near streams, lands located near wildlife areas, and lands situated on prime farmland.
The ranking scale for Risk Assessment is that the lower the total score, the least suitable that piece of land is. The higher the score, the more suitable that piece of land is. Please refer back to the master key for details on the value meanings
The first risk assessment factor I am looking at is Residential Zoned areas. Here I took all the residential zoned areas located within the Trempealeau County database and ran a Euclidean Distance tool. The reason for running the Euclidean Distance tool is because sand mines can not be located within 640 meters of residential areas. After running the tool, I then reclassified the the Euclidean distance to 1 class, and gave it a rating of 3 for highest risk assessment possible.

Figure 9 is a Residential Zone Risk Assessment map for Trempealeau County
The second risk assessment is the placing of mines within 640 meters of school parcels. Using the same process as before, a Euclidean distance was ran based on parcel data that was queried to find all school parcel data within Trempealeau County. I than reclassified the data to give the areas not impacted a 3.

Figure 10 is a Risk Assessment map of school parcel data in Trempealeau County
The third map created was a risk assessment map of sand mines located near streams. Using the same process before, I created a Euclidean Distance The reason being is that I believe a mile is a fair amount a distance where an industry should need to be aware of potential stream pollution, and the primary and secondary streams are the larger streams located within the county. Again, a reclass was created to give areas that fall within certain distance as seen in the master key. A 1 was given for high risk assessment while a 3 was given for a low risk assessment.

Figure 11 is a Risk Assessment map of locations of streams
The fourth map is a risk assessment of lands near a wildlife area within the county. Using the master key as a breakdown, The estimated breakdown in meters should provide enough of a buffer if an accident or pollution would occur and not affect the area right away before it could be contained. Using the Euclidean Distance tool and then reclassisfying it, a scale was created around the wildlife area and a 1 was given for areas of high risk assessment and a value of 3 for a low risk assessment

Figure 12 is a Risk Assessment map of locations located near a wildlife area
Another assessment is a map of all the prime farmland located within the county. Prime farmland is a rarity and once a sand mine is put on it, the farm land would lose its value. Here I reclassified the prime farmland and gave it a value of a 1 for highest risk assessment, and a value of 3 for the lowest risk assessment

Two viewsheds were created also in this risk assessment. Using parks and trails, viewsheds were used to create a map of viewable locations from these parks and trails. As to not disturb the natural beauty Trempealeau County has to offer, I eliminated the parcels of land that were viewable from the viewshed analysis, and gave the non seeable locations a value of 3 for low risk assessment.


Figure 14 and 15 are the viewshed analysis of the parks and trails located in Trempealeau County
The final step is to run a raster calculator and combine these maps. Values are range from 12 to 18. I ran the raster calculator and figure 16 shows the results of the calculations and the areas of highest risk assessment. Again as previously stated the lower the value, the least suitable that piece of land is and has a greater risk assessment. The higher the value, the lower the risk assessment is and the more suitable that piece of land is.

Figure 16 is a Risk Assessment map of Trempealeau County

Figure 17 is the model builder image of the all the tools used in this assessment
Results and Conclusion
Looking at each map individually, you can see how random the values are. You can find 30 by 30 meter squares with a value of 14 next to 30 by 30 meter square with a value of 5 in the Land Suitability maps. the same can be said with Risk Assessment maps, you can find a 30 by 30 meter square with a value of 12 next to a 30 by 30 meter square with a value of 18.
Sand mine companies are going to have to weight choices. Will it be best to put a mine on a parcel with a score of 14 next to a parcel that scores a 5 or is it better to put a mine on parcel with a score 10, with all the surrounding parcels a 10 also. These are the kinds of decisions the companies will face. Maps like these can help shift a decsision one way or another.
While looking at the overall outputs of both the Risk Assessment and Land Suitability maps, we can the there are many different locations within Trempealeau County that have a wide range of values. Until we overlay the two maps and find out a difference between land suitability and risk assessment, we do not have an accurate value for each 30 by 30 square.
Overall this report challenged a GIS professional under many differnt levels. The ability to maintain and organized geodatabase was the toughest issue I had because of all the differnt tools we were running. The next toughest challenge was being able to maintain out 30 by 30 meter spatial resolution and maintaining the integrity of map accuracy. Without map accuracy, credibility of the map is completely gone.
Notes
These maps are created using data not collected by myself. I am not liable for all maps and assessments based of these maps. Use these maps at your own risk.
No comments:
Post a Comment